


Most agencies don't have a capacity problem. They have a timing problem. The hiring happens three months after the overload started, the new CSR takes another two months to get productive, and by the time they're useful, renewal season has already chewed through your retention numbers. You felt the strain in March, posted the job in June, and the person was finally pulling weight in September — right when things calmed down.
That lag is the whole ballgame. Good agency capacity planning isn't about predicting the future perfectly. It's about building a model that tells you to act before the queue gets ugly, using numbers you already have sitting in your management system.
Here's how to build one that actually works, where it tends to fall apart, and what the triggers should look like by role.
Why headcount decisions lag production (and why it gets worse as you grow)
Almost every owner falls into the same pattern. You staff to the average. You look at how busy the team is on a normal week, decide everyone's handling it fine, and move on. The problem is that insurance work isn't flat — it clusters.
A commercial-heavy book has ugly Q4 and Q1 renewal stacks. Personal lines has its own rhythm tied to mortgage and auto-buying cycles. Then you get event spikes — a carrier non-renews a whole segment and suddenly your service team is remarketing 80 accounts in three weeks that weren't on anyone's forecast.
-
Renewals going out late, which hits retention
-
Endorsements sitting in a queue for days
-
New business quotes taking too long, so prospects go elsewhere
-
Your best CSR quietly burning out and updating their resume
None of those show up as a line item that says "we're understaffed." They show up as retention drift and turnover, which you then misdiagnose as a people problem.
The core idea: production metrics drive the model, not revenue
Revenue-based staffing math is tempting because it's simple — "we'll add a CSR for every $X in commission." But revenue is a lagging, blunt signal. It doesn't tell you what kind of work is coming or when the load actually hits.
Eliminate paperwork bottlenecks and missed deadlines.
Covixly helps you track, manage, and close every policy and claim with confidence and speed.
- Unified policy & claims management
- Automated client notifications
- Agent task coordination
No credit card required
Production metrics are better because they map directly to human hours. The ones worth tracking for capacity:
-
Policies in force per service person (split personal vs. commercial — they're not the same unit of work)
-
New business items quoted per week per producer
-
Endorsement/service requests per week per CSR
-
Renewals due per month on a rolling 90-day horizon
-
Claims opened per week if your agency does hands-on claims support
The trick is figuring out your capacity constant — how many of each unit one fully-ramped person can handle at a sustainable pace. Not the heroic pace during crunch. The sustainable one.
A seasoned personal-lines CSR comfortably services somewhere around 1,000–1,400 policies in force, depending on how much the book self-services and how clean your data is. A commercial CSR handling mid-market accounts might top out around 150–250 because each one carries more endorsements, COIs, and back-and-forth. Those numbers aren't universal — you have to calibrate them against your own team — but they're the backbone of everything that follows.
If you haven't already defined what "handling it" even means per role, this is where a clear SLA framework for agents, CSRs and underwriters becomes the foundation. Your capacity constant is basically "how much work can one person do while still hitting SLA." Without that baseline, you're just guessing at what sustainable looks like.
Building the seasonality layer
This is where most homemade staffing spreadsheets fall apart. They use a flat monthly average and completely miss that February and October might carry 40% more renewal volume than July.
You build the seasonality adjustment by pulling at least 24 months of history — two full cycles so you can tell a real pattern from a one-off. For each month, calculate a seasonality index: that month's volume divided by the 12-month average. A value of 1.0 is an average month. 1.35 means that month runs 35% hotter than normal.
| Month | Renewals due | Seasonality index |
|---|---|---|
| January | 180 | 1.30 |
| February | 165 | 1.19 |
| March | 120 | 0.87 |
| April | 110 | 0.79 |
| May | 105 | 0.76 |
| June | 115 | 0.83 |
| July | 125 | 0.90 |
| August | 140 | 1.01 |
| September | 155 | 1.12 |
| October | 175 | 1.26 |
| November | 150 | 1.08 |
| December | 125 | 0.90 |
The averages here are illustrative — yours will be shaped by your carrier mix and renewal distribution. But the point is the shape. Once you have the index, your forecast for any upcoming month is:
Forecasted volume = projected annual volume ÷ 12 × seasonality index for that month
Divide forecasted volume by your capacity constant to get required headcount. If January needs 1.3× the average workload and you're staffed for the average, you are structurally short-handed every single January. The model makes that visible months ahead instead of in the middle of the pileup.
One thing people miss: seasonality compounds across roles. A renewal spike doesn't just hit service — it hits producers on remarketing, underwriting liaison work, and claims if the segment is weather-exposed. A single index on "renewals" undersells the actual strain. Track the index separately for new business, service, and renewals, because they peak at different times and pull on different people.
Here's a quick workflow to visualize the seasonality-to-headcount process.
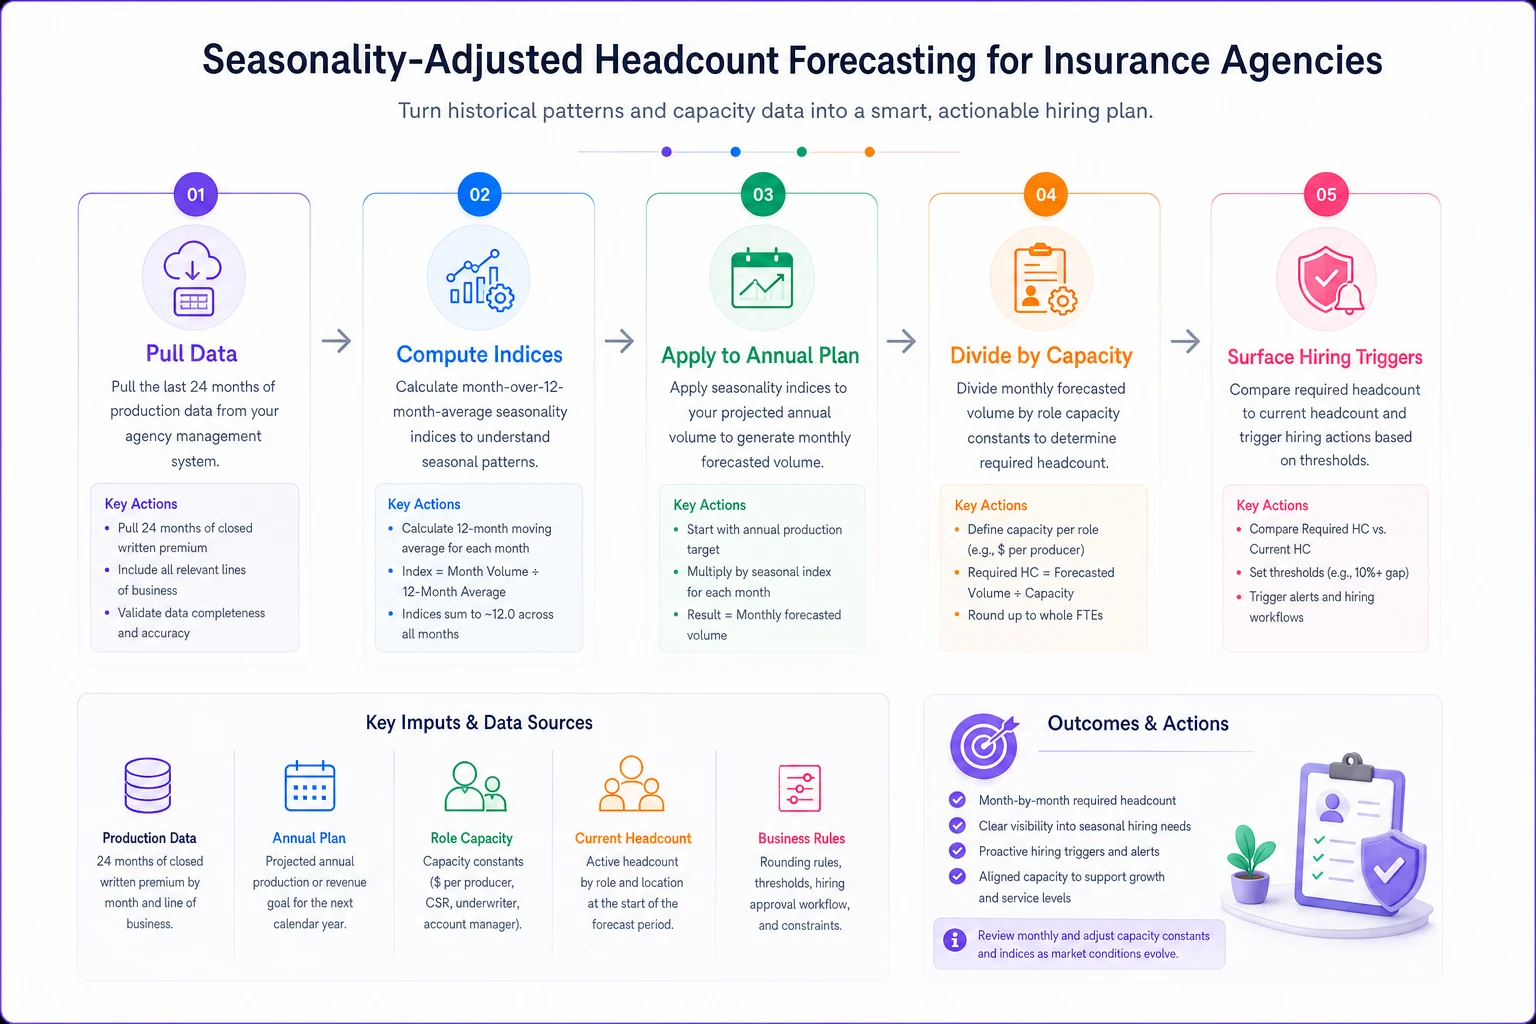
Keeping the seasonality and capacity math visible means you can translate a forecast into a timed hiring decision rather than a panicked reaction.
Hiring triggers: the part that actually changes behavior
A forecast sitting in a spreadsheet does nothing. The value comes from converting it into triggers — specific thresholds that, when crossed, start a predefined action. This is the discipline that kills the three-month lag.
Your trigger has to fire before capacity is exhausted, accounting for hiring time plus ramp time. If it takes 6–8 weeks to hire and another 8–12 weeks to get someone productive, your trigger needs roughly a four-to-five-month runway built in. That means hiring when you're at maybe 80–85% of capacity on a forecasted basis, not when you hit 100% of actual.
-
Watch trigger (80% forecasted utilization) Flag it. Start passive recruiting — keep a warm pipeline, don't post yet. Check whether automation or process cleanup can claw back capacity instead.
-
Act trigger (85–90% forecasted, sustained 2+ months) Post the role. The "sustained" part matters — one hot month from a carrier remarket isn't a reason to add permanent headcount.
-
Overflow trigger (95%+ actual, or SLA breaches climbing) Bridge with temp or contract help while the hire ramps. This is the pressure valve, not the plan.
Notice the sustained-months condition. The most expensive capacity mistake isn't hiring too late — it's overreacting to a single spike, hiring permanently, then carrying the cost through the slow season. Temporary surges call for temporary solutions.
For roles with long ramps, back-calculate hire dates from peak season so posting happens early enough.
A workable trigger framework:
Sample triggers and thresholds by role
Different roles have different ramp times and different signals, so the thresholds shouldn't be identical. Here's a sample structure you can adapt:
| Role | Primary metric | Watch threshold | Act threshold | Ramp time | Bridge option |
|---|---|---|---|---|---|
| Personal-lines CSR | Policies in force / person | ~1,100 | ~1,250 | 8–10 wks | Overtime, temp |
| Commercial CSR | Accounts / person | ~170 | ~210 | 12–16 wks | Overflow to senior CSR |
| Producer | New biz quotes/wk at target close rate | 85% of quota | At quota 2 mos | 4–6 mos | Marketing support |
| Claims specialist | Open claims / person | ~35 | ~45 | 6–8 wks | Triage routing |
| Account manager (large commercial) | Revenue + account count | 90% of band | Over band 1 qtr | 4–5 mos | Junior support hire |
A few notes on using this. Producers need their own logic because their ramp is the longest and their output is the least predictable in the first six months — you hire producers for future capacity, not current overflow. Commercial CSRs have the longest service ramp because account complexity means tribal knowledge matters more. For roles with long ramps, your trigger has to fire earliest.
These thresholds connect directly to the metrics you should already be watching on your prioritized KPI dashboard. The dashboard tells you where you are; the capacity model tells you where you're heading and when to pull the trigger.
A real scenario
A regional agency, mostly commercial lines, about 14 people. Three service CSRs carrying roughly 190–220 accounts each — already over a comfortable load. The owner knew Q4 was always brutal but staffed reactively every year, usually pulling in a temp around November when the renewal stack was already overflowing.
The problem wasn't the temp. It was that the temp arrived untrained during the worst week of the year and actually slowed the team down for the first two weeks while someone held their hand through basic processes. Commercial renewals were going out an average of 5–6 days late, and retention on accounts touched late ran noticeably worse than their clean renewals.
They built out the seasonality index and found their October–January load ran about 1.25–1.30× average. Working backward from a 12–16 week commercial-CSR ramp, the math said: post the role in June, not November. They did. The new CSR was carrying real weight by late September, right before the stack hit.
The temp still came in for the peak weeks — but now as pure overflow on simpler tasks, not a desperate plug. Renewal turnaround during Q4 dropped back under 2 days. Retention on that late-renewal bucket recovered over the following year. Nothing dramatic month to month, but the full-year difference in a book that size was real money, and the team stopped dreading Q4.
The fix wasn't working harder. It was moving the hiring decision four months earlier using numbers they already had.
Where capacity models break down
A few failure points worth naming, because the model is only as good as its inputs:
-
Dirty policy counts. If your management system has duplicate or mis-coded policies, your capacity constant is built on sand. Garbage volume in, garbage headcount out.
-
Treating all accounts as equal units. A 12-location commercial account is not one unit of work. If your book is shifting toward complexity, your "accounts per CSR" constant drifts even when the count holds steady.
-
Ignoring ramp reality. The most common error by far. People model the hire as instantly productive and are surprised when capacity doesn't improve for two months.
-
No overflow valve. If your only two settings are "fine" and "hire someone permanent," you'll either overstaff or burn people out. You need a defined bridge option.
-
Forgetting the model is a living thing. Carrier changes, a lost or won large account, a new product line — all of these shift your constants. Recalibrate at least quarterly.
Where modern operational platforms genuinely help is pulling production metrics automatically — policies in force, requests per CSR, renewals on the horizon — so the forecast updates off live data instead of a spreadsheet someone remembers to refresh twice a year. The math isn't hard. Keeping the inputs current and the triggers visible is the part that quietly falls apart, and that's exactly the kind of ongoing tracking that's painful to do by hand.
When this is worth building — and when it isn't
It makes sense when you're past the point where the owner can personally absorb overflow — roughly seven-plus people — and when your book has real seasonality. If you're carrying a meaningful renewal cluster or a complexity mix that strains specific roles, the model pays for itself in avoided retention loss and avoided panic hires.
It's probably overkill when you're a three-person shop with a flat, stable book. At that size you can feel the capacity in the room, and a lightweight look at the renewal calendar does most of the job. Don't build a 24-month seasonality index to manage three people.
Be careful if your data is a mess. Build the model on bad counts and it'll confidently tell you to hire the wrong role at the wrong time. Clean the policy data first, then model.
The whole point of a production-based capacity model is to turn hiring from a reactive scramble into a scheduled decision you see coming months out. You already have the production numbers. Attach a seasonality shape to them, set triggers that account for hiring and ramp lag, and you stop paying the quiet tax of late renewals and burned-out CSRs every peak season.
The agencies that get this right aren't the ones with the best forecasts — they're the ones who actually act on the trigger instead of waiting until it hurts.
Ready to transform your insurance agency operations?
Join 500+ agencies using Covixly to reduce manual work, improve client service, and grow their book of business.