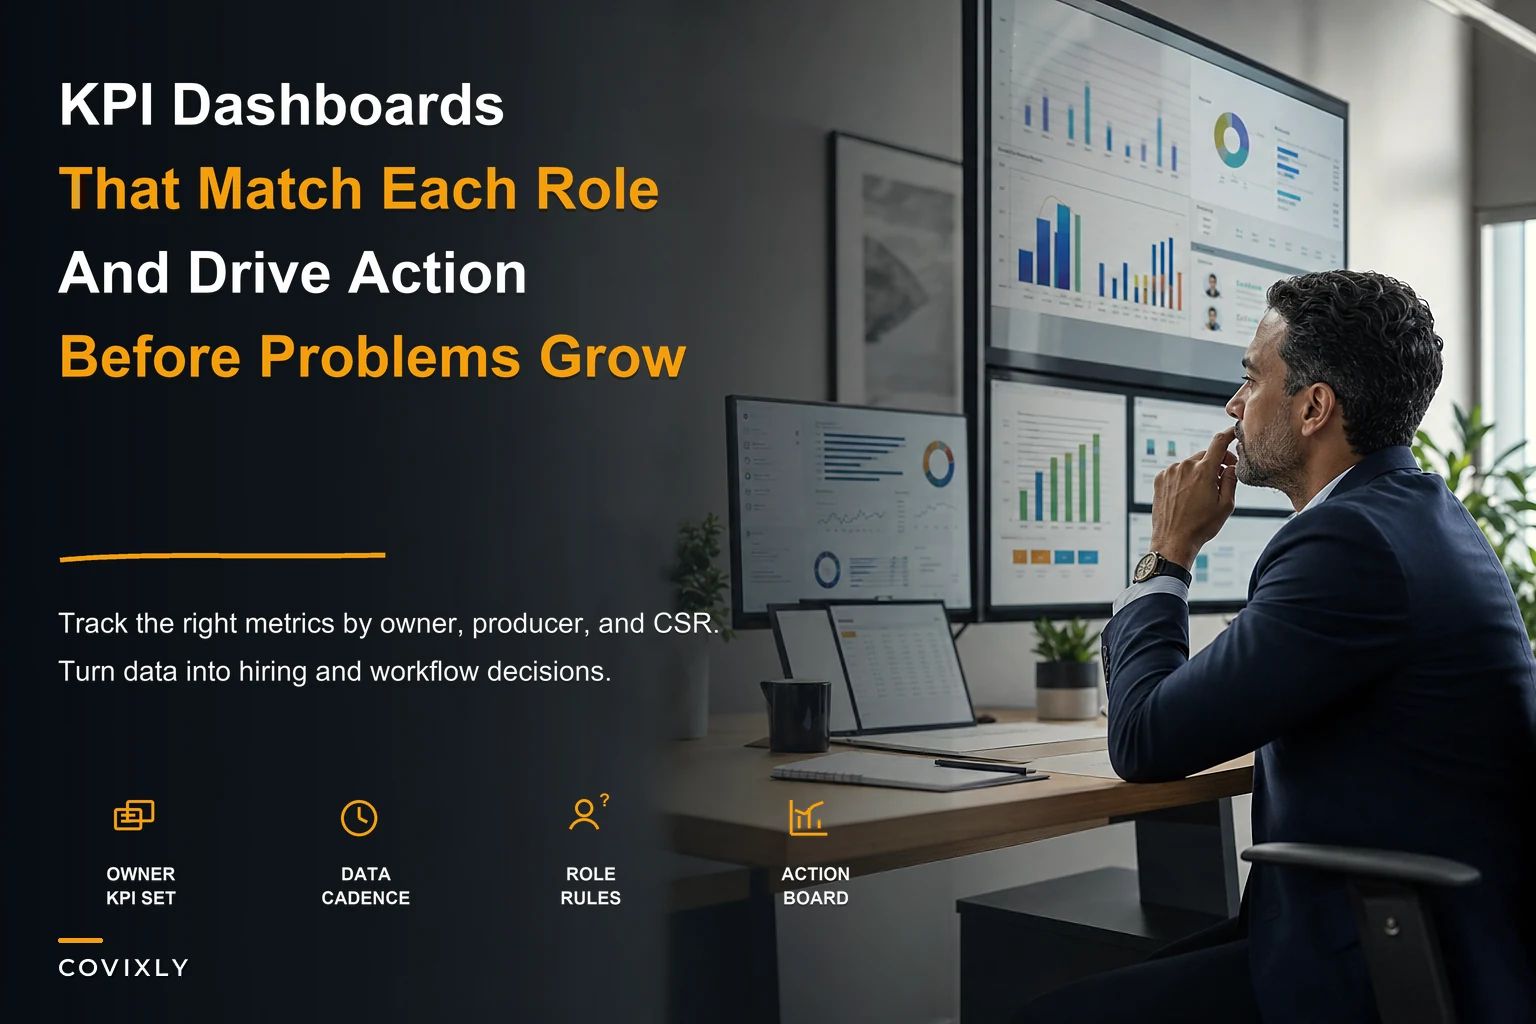

Most insurance agency dashboards fail because they track everything equally. Revenue, policies sold, retention rates, lead conversion, customer satisfaction scores—it all sits there in neat little boxes, updated daily, telling you nothing about what to actually do tomorrow morning.
The real problem isn't tracking metrics. It's understanding which metrics matter for which roles, when to check them, and what specific actions they should trigger. An agency with eight people needs completely different dashboard priorities than one with twenty-five. Yet most agencies use the same generic insurance agency KPIs dashboard regardless of their size or structure.
Why traditional KPI tracking breaks down in insurance agencies
Insurance agencies have a unique operational challenge: different roles operate on wildly different time horizons. Your producers might close three policies today while your account managers are working on renewals that won't mature for eleven months. Your CSRs handle immediate service issues while your marketing coordinator plans campaigns for next quarter.
This creates a fundamental mismatch. When everyone looks at the same dashboard with the same frequency, you get one of two outcomes. Either the producers ignore the long-term retention metrics that don't affect their daily work, or the account managers get overwhelmed by daily lead flow data that has nothing to do with their responsibilities.
The bigger issue? Decision paralysis. Your dashboard shows new business revenue down 12% this month. Should you increase marketing spend? Adjust your producer compensation? Change your lead distribution? Lower your target market criteria? Without role-specific context and clear decision triggers, that 12% decline becomes another number to worry about rather than a signal for specific action.
Then there's the scaling problem. A five-person agency where everyone wears multiple hats needs broad visibility across all metrics. But once you hit fifteen people with specialized roles, that same broad visibility creates noise. Your commercial lines producer doesn't need to see personal lines retention rates every morning. Your personal lines CSR doesn't need to track commercial renewal pipelines.
The role-priority framework that changes everything
Instead of building one dashboard for everyone, you need a hierarchy of dashboards based on decision-making authority and operational impact.
Eliminate paperwork bottlenecks and missed deadlines.
Covixly helps you track, manage, and close every policy and claim with confidence and speed.
- Unified policy & claims management
- Automated client notifications
- Agent task coordination
No credit card required
Agency Owner Dashboard
Focus on systemic health and resource allocation decisions. Check weekly for trends, monthly for decisions.
Primary metrics:
-
Total revenue vs. target (weekly trend)
-
Cash flow position (daily if under $50k reserves, weekly otherwise)
-
Producer efficiency ratio
revenue per producer vs. cost (monthly)
-
Overall retention rate by line of business (monthly)
-
Marketing cost per acquisition by channel (monthly)
Decision triggers embedded in the dashboard:
-
If producer efficiency drops below $3 revenue per $1 cost for 2 months → review comp structure or territories
-
If retention drops below 85% for any line → launch retention audit process
-
If CPA exceeds $400 for any channel → pause or adjust that channel
-
If cash reserves drop below 45 days of operating expenses → implement collection acceleration protocol
Sales Manager Dashboard
Focus on pipeline health and producer performance. Check daily for activity, weekly for performance.
Primary metrics:
-
Pipeline value by stage and producer (daily)
-
Activity metrics
calls, quotes, appointments per producer (daily)
-
Close rate by producer and product line (weekly)
-
Average deal size trending (weekly)
-
Time stuck in each pipeline stage (weekly)
Decision triggers:
-
If any producer's activity drops below 80% of target for 3 days → immediate one-on-one
-
If pipeline coverage drops below 3x monthly target → increase lead generation immediately
-
If close rate drops 10% week-over-week → review and adjust sales process
-
If average deal size drops 15% → shift focus to higher-value prospects
Account Manager Dashboard
Focus on retention and service quality. Check weekly for most metrics, daily during renewal seasons.
Primary metrics:
-
Renewal pipeline by month (check daily starting 60 days out)
-
At-risk accounts flagged by criteria (weekly)
-
Service ticket resolution time (weekly)
-
Cross-sell opportunities identified (monthly)
-
Client touchpoint frequency by tier (weekly)
Decision triggers:
-
If renewal pipeline shows less than 80% contacted 30 days out → all hands on renewal calls
-
If any A-tier client hasn't been contacted in 60 days → immediate outreach
-
If service tickets exceed 48-hour resolution → redistribute workload
-
If cross-sell rate drops below 15% of renewals → launch refresher training
Focus on retention and service quality. Check weekly for most metrics, daily during renewal seasons.
Building the data cadence that prevents firefighting
The biggest mistake agencies make is checking everything daily. Daily data creates daily panic. Most insurance metrics need time to develop meaningful patterns.
Daily checks (only for operational necessities):
-
Cash position if reserves are tight
-
New leads received and distributed
-
Critical service issues or claims
-
Producer activity levels (calls/appointments made)
Weekly checks (for performance management):
-
Pipeline movement and velocity
-
Conversion rates by stage
-
Team productivity metrics
-
Customer service metrics
Monthly checks (for strategic decisions):
-
Profitability by line of business
-
Marketing ROI by channel
-
Compensation efficiency
-
Market penetration metrics
Quarterly checks (for structural changes):
-
Competitive position metrics
-
Market share analysis
-
Long-term retention cohorts
-
Organizational efficiency ratios
The key is matching the checking frequency to the decision frequency. If you can't make a meaningful change based on daily data, don't check it daily. You're just creating anxiety without actionable insight.
The decision rules that eliminate confusion
Every metric on your dashboard needs a clear decision rule. Not a vague "monitor this" notation, but a specific "if X happens, do Y" instruction.
For a 10-15 person agency, here's what your core decision matrix looks like:
| Metric | Threshold | Immediate Action | Who Decides |
|---|---|---|---|
| New business revenue | -10% vs. target (monthly) | Audit lead quality and distribution | Sales Manager |
| Producer efficiency | Below $250k annual per producer | Review territory or training needs | Owner |
| Retention rate | Below 85% any line | Launch save campaign | Account Manager |
| Service tickets | >48 hour average resolution | Add temporary help or redistribute | Operations Manager |
| Marketing CPA | >$400 any channel | Pause channel and investigate | Marketing/Owner |
| Cash reserves | <45 days operating expenses | Accelerate collections, delay non-critical expenses | Owner |
| Pipeline coverage | <3x monthly target | Increase marketing spend or activity requirements | Sales Manager |
These aren't suggestions—they're automatic triggers. When the metric hits the threshold, the designated person takes the specified action. No meetings to discuss whether it's a problem. No waiting to see if it improves. The decision is pre-made.
How metrics change as your agency scales
The metrics that matter at 5 people become noise at 25 people.
5-10 person agency:
Everyone needs visibility into everything. Your dashboard is broad but shallow—tracking all major metrics but not diving deep into role-specific performance. Individual performance metrics matter less than overall agency health. You're watching for major problems, not optimizing efficiency.
10-20 person agency:
Roles start specializing. You need separate dashboards for production vs. service. Individual performance metrics become critical. You start tracking efficiency ratios, not just total numbers. Your hiring decisions become data-driven—when specific metrics hit thresholds, you know exactly which role to hire next.
20-40 person agency:
Full departmentalization requires department-specific dashboards. You need predictive metrics, not just historical ones. Pipeline velocity and coverage ratios matter more than activity metrics. Quality metrics (client satisfaction, retention by tier) become as important as quantity metrics. You implement automated alerting when metrics hit triggers.
40+ person agency:
You need real-time operational dashboards plus strategic executive dashboards. Cohort analysis becomes critical—tracking performance by client acquisition date, producer, product line. Predictive analytics drive resource allocation. Your dashboards integrate directly with operational systems to trigger automated workflows.
The hiring triggers hidden in your metrics
When to hire another producer:
-
Existing producers averaging >$300k annual revenue each
-
Lead response time exceeding 2 hours consistently
-
Pipeline coverage exceeding 5x monthly target (too many leads)
-
Close rate maintaining above 25% for 3 months
When to hire another account manager:
-
Account manager handling >150 active accounts
-
Renewal contact rate dropping below 90% at 30 days out
-
Service ticket resolution exceeding 48 hours average
-
Cross-sell rate dropping below 10% due to time constraints
When to hire another CSR:
-
Phone abandon rate exceeding 5%
-
First-call resolution dropping below 80%
-
Service ticket backlog exceeding 2 days of volume
-
Account managers spending >30% time on service tasks
When to hire operations/support roles:
-
Manual data entry exceeding 20% of any role's time
-
Report generation taking >4 hours weekly
-
Compliance audit findings increasing
-
System errors affecting >5% of transactions
Your dashboard should tell you exactly when to hire and for which role. Most agencies hire when they feel overwhelmed. Better agencies hire when specific metrics hit predetermined thresholds.
The marketing decisions your dashboard should make obvious
Marketing spend in insurance agencies often runs on gut feel and relationship inertia. Your dashboard should make channel decisions mathematical.
Cost per acquisition by channel:
-
If CPA exceeds $400 → reduce spend by 50% and test improvements
-
If CPA under $200 → increase spend by 30% immediately
-
If CPA between $200-400 → maintain and optimize
Lead quality score by source:
-
If close rate from source <10% → eliminate or completely restructure
-
If close rate 10-20% → reduce spend and improve qualifying
-
If close rate >20% → maximize spend within budget
Channel velocity metrics:
-
If leads from channel take >30 days to close → adjust expectations and pipeline coverage
-
If leads close within 14 days → prioritize for cash flow
-
If seasonal patterns emerge → adjust spend timing accordingly
Attribution accuracy:
-
If >20% of new business has unknown source → implement better tracking before making any channel decisions
-
If attribution conflicts exist → use conservative model (last touch)
-
If referral source unclear → default to relationship mapping
Marketing spend in insurance agencies often runs on gut feel and relationship inertia. Your dashboard should make channel decisions mathematical.
Building the actual dashboard infrastructure
The technical setup matters less than the decision framework, but you need certain capabilities to make this system work.
Your dashboard platform needs to:
-
Pull data from multiple sources automatically
-
Update at different frequencies for different metrics
-
Send alerts when triggers are hit
-
Show trends, not just current numbers
-
Display different views for different roles
-
Track when decisions were made based on triggers
Most agencies cobble together Excel sheets updated manually. This breaks around 12-15 people when the manual updating becomes a part-time job itself. That's when you need to move to automated systems that pull data directly from your management system, CRM, and marketing platforms.
The integration work feels painful, but the alternative is making million-dollar decisions based on two-week-old data. Or worse, making no decisions because the data is too hard to gather.
Modern AI-powered operational software can automate most of this dashboard creation and maintenance. Instead of manually pulling reports and updating spreadsheets, these platforms continuously sync data from all your systems, calculate your KPIs automatically, and alert the right people when triggers are hit. The AI components can even identify patterns you might miss—like correlation between certain producer behaviors and retention rates six months later.
Prioritize automating high-frequency metrics first (leads, cash position, producer activity) to immediately cut manual work.
Here's a quick visual of the integration workflow.
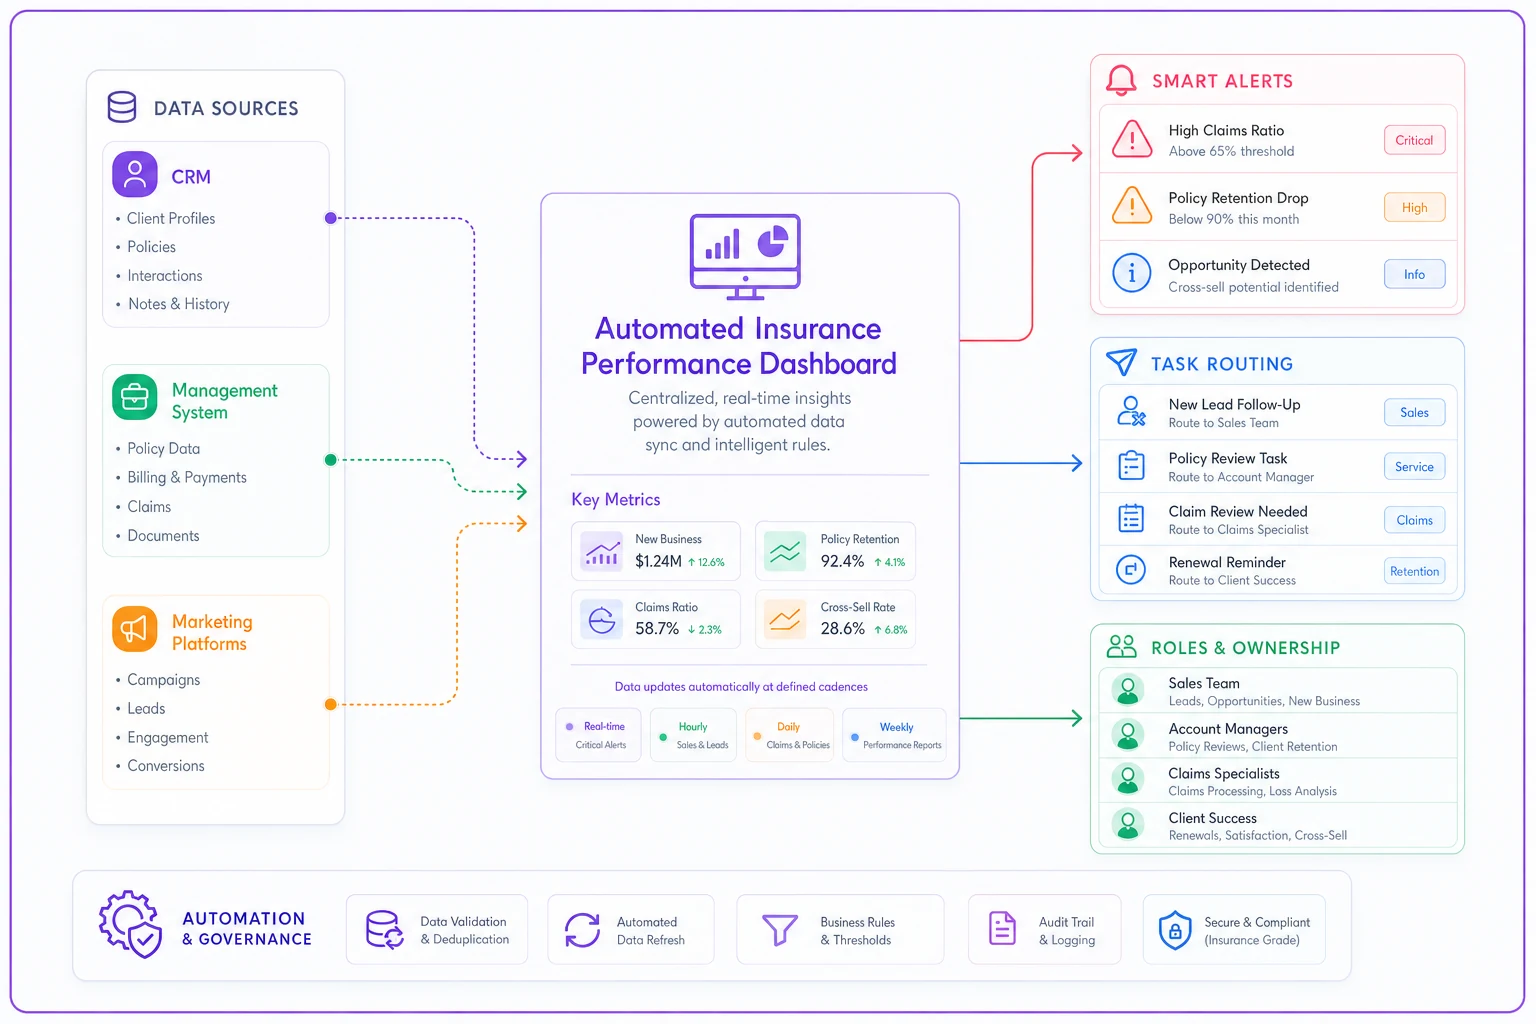
The integration work feels painful, but the alternative is making million-dollar decisions based on two-week-old data. Or worse, making no decisions because the data is too hard to gather.
The weekly rhythm that makes dashboards actually work
Having the right dashboard means nothing if you don't have a rhythm for using it.
Monday morning: 15-minute dashboard review
-
Check all triggered alerts from the previous week
-
Identify metrics trending toward triggers
-
Assign specific actions based on decision rules
Wednesday: Deep dive on triggered metrics
-
For any triggered metric, run root cause analysis
-
Document what drove the trigger
-
Adjust process or resource allocation
Friday: Forward-looking pipeline review
-
Check pipeline coverage for next 30 days
-
Identify resource constraints developing
-
Make proactive adjustments before triggers hit
Monthly: First Monday full review
-
Review all metrics against targets
-
Identify patterns across multiple triggers
-
Adjust thresholds if needed based on business changes
-
Update decision rules based on what worked/didn't work
This rhythm means you're never more than 48 hours away from catching a problem, but you're not drowning in daily data that doesn't drive decisions.
When dashboard complexity becomes the enemy
There's a point where more metrics make decisions worse, not better. Usually happens around 20-25 tracked KPIs. Analysis paralysis sets in. Everything seems important. Nothing gets decided.
Signs your dashboard has become too complex:
-
Reviews take over an hour
-
Multiple metrics conflict with each other
-
Team members ignore most of the dashboard
-
You need meetings to interpret what the data means
-
Decisions get delayed while gathering "one more metric"
The fix is brutal prioritization. For each role, identify the 3-5 metrics that most directly drive their daily decisions. Everything else becomes monthly or quarterly review material. Your agency might track 50 metrics total, but each person only sees 5-7 relevant to their immediate decisions.
The difference between vanity metrics and decision metrics
Insurance agencies love tracking big impressive numbers. Total premium written. Total policies in force. Total clients served. These feel good but drive zero daily decisions.
Real decision metrics are ratios and trends:
-
Revenue per producer per month (not total revenue)
-
Close rate by lead source (not total closes)
-
Retention rate by account manager (not total retention)
-
Cost per acquisition by channel (not total marketing spend)
-
Service tickets per CSR per day (not total tickets)
The test: Can you make a specific operational change based on this metric moving 10%? If not, it's a vanity metric. Move it to the quarterly business review deck and off your operational dashboard.
The behavioral psychology of dashboard adoption
The best dashboard in the world fails if your team doesn't actually use it. And most don't, because dashboards typically feel like surveillance rather than support.
To drive adoption, each person needs to see how the dashboard helps them win, not just how it helps you monitor them.
For producers:
Show them their close rate improving over time, their average deal size growing, their pipeline velocity accelerating. Let them see which activities correlate with their best months.
For account managers:
Display their save rate on at-risk accounts, their cross-sell success rate, their client satisfaction scores by tier. Show them winning, not just working.
For CSRs:
Track their first-call resolution rate, their tickets-closed daily records, their contribution to retention. Make heroes of efficiency, not just activity.
When metrics become a way for team members to compete with their own best performance rather than a tool for management surveillance, adoption happens naturally.
The overlooked power of negative space
Sometimes what you don't track matters as much as what you do. Every metric you add to the dashboard implies that metric matters for success. This drives behavior, whether you intend it or not.
If you track calls made but not conversations quality, you get high volume garbage calls. If you track policies sold but not retention rate by producer, you get churn machines. If you track tickets closed but not customer satisfaction, you get efficient but angry clients.
The discipline is choosing what not to measure. Yes, you could track everything. But tracking everything means optimizing nothing. Your dashboard is as much about focus as it is about information.
Making peace with imperfect data
Most agencies delay building proper dashboards because their data isn't perfect. Some clients are coded wrong. Attribution isn't completely accurate. Historical data has gaps.
Operating with 80% accurate data updated daily beats operating with 100% accurate data updated monthly. Directional accuracy matters more than decimal-place precision for operational decisions.
Start with what you have. Make decisions based on trends rather than absolute numbers. As you use the dashboard, you'll naturally identify which data quality issues actually affect decisions and which ones don't matter. Fix the ones that matter. Accept the ones that don't.
Most insurance agencies run on intuition, relationship history, and whoever yells loudest. The agencies that will dominate the next decade run on data-driven decisions with clear triggers and accountability.
Your insurance agency KPIs dashboard isn't just about tracking performance. It's about creating a decision-making operating system that scales beyond what any individual can hold in their head. When every person knows exactly which metrics they own, what thresholds trigger action, and what specific steps to take, you've built an agency that can scale without falling apart.
The agencies still updating Excel sheets monthly and making gut-feel decisions won't be able to compete with agencies where every role has clear metrics, automated tracking, and predetermined decision triggers. The question isn't whether to build this system—it's whether you'll build it before your competition does.
Start with role-specific metrics. Add decision triggers. Set checking cadences that match decision frequencies. Automate the data collection. Create the weekly rhythm. Then watch as decisions that used to take hours of meetings start happening automatically, driven by data rather than debate.
Ready to transform your insurance agency operations?
Join 500+ agencies using Covixly to reduce manual work, improve client service, and grow their book of business.