



Most agency P&Ls are built to satisfy an accountant, not to run a business. You get one clean statement: total commission revenue, total payroll, rent, E&O, tech stack, marketing, and whatever's left is "profit." It ties out. Your CPA is happy. And it tells you almost nothing about where the money actually comes from or where it quietly leaks out.
The problem shows up the year your revenue climbs 12% but your take-home barely moves. Owners feel it before they can explain it — they're writing bigger commission checks, adding a CSR, upgrading the AMS, and somehow the bank account looks the same. The blended P&L can't answer the obvious next question: which product lines, which producers, and which acquisition channels are actually funding the agency, and which ones are being carried?
This playbook is about tearing that single number apart — not as a one-time audit, but as a repeatable quarterly discipline you can bring to a board or partner meeting and actually make decisions from. We'll cover how to decompose the P&L across three axes, how to allocate shared costs without losing your mind, what thresholds should trigger action, and how to package it so the quarterly conversation is about decisions instead of debate.
The three axes that actually explain agency profit
A blended P&L collapses three completely different profitability stories into one line. When you separate them, patterns show up that were invisible before.
By product line. Personal auto, homeowners, small commercial, benefits, life — each carries its own commission rate, servicing load, retention curve, and loss-of-appointment risk. A book that's 70% personal auto can look fine on revenue and terrible on margin once you count the service hours behind those low-premium policies.
By producer. Not just who wrote the most premium — who wrote profitable premium after you subtract the servicing their book demands, the base draw, the split, and the accounts they lose at renewal. A producer doing $600k in new business who churns 30% of it is a completely different situation than one doing $400k with 92% retention.
By channel. Referral, direct web lead, purchased leads, cross-sell from existing book, walk-in, networking. Cost-per-acquired-client varies wildly, and so does the lifetime value of what comes through each door. Purchased leads that convert at 4% and cancel within eight months can post positive first-year revenue and negative three-year profit.
The insight most owners miss: these three axes interact. A producer looks unprofitable until you notice they're stuck servicing a low-margin product mix assigned to them, sourced through a bad channel someone else picked. You can't fix the producer without fixing the product and channel feeding them. That's why you decompose all three, not just one.
Step-by-step: decomposing the P&L
Do this in order — each step depends on the allocations from the one before.
Eliminate paperwork bottlenecks and missed deadlines.
Covixly helps you track, manage, and close every policy and claim with confidence and speed.
- Unified policy & claims management
- Automated client notifications
- Agent task coordination
No credit card required
-
Pull direct revenue by policy, tagged three ways. Every policy or account gets a product tag, a producer tag, and an origin/channel tag. Your AMS has most of this; the channel tag is usually the gap. Commission (new and renewal) is your revenue line at the policy grain.
-
Assign direct costs that already belong to something. Producer splits, sub-agent commissions, and lead costs tied to a specific campaign are direct — they attach cleanly to a producer or channel. Book these before you touch anything shared.
-
Estimate servicing load by product. This is the step everyone skips, and it matters more than any other. You need a rough time-per-policy-per-year for each product line: endorsements, COIs, billing questions, renewals, claims support. You don't need a stopwatch — a two-week service-request tally by product gets you close enough.
-
Convert servicing time to cost and allocate. Take fully loaded CSR/service cost, divide by available service hours, and you have a cost-per-service-hour. Multiply by the servicing hours each product consumes. Now personal auto's real cost shows up instead of hiding in "payroll."
-
Allocate overhead with defensible rules. Rent, admin, management, tech, E&O — spread these across the axes using drivers that make sense (headcount, policy count, revenue). More on the rules below.
-
Build the three margin views. Product margin, producer margin, channel margin. Same underlying numbers, sliced three ways.
-
Compare against thresholds and flag actions. This is what turns analysis into a board conversation.
The output isn't a perfect number — it's a directionally honest one. A P&L that's 90% right by product is infinitely more useful than a blended one that's 100% right about nothing actionable.
Below is a rough sequence showing how data flows from policy tagging through to quarterly decisions:
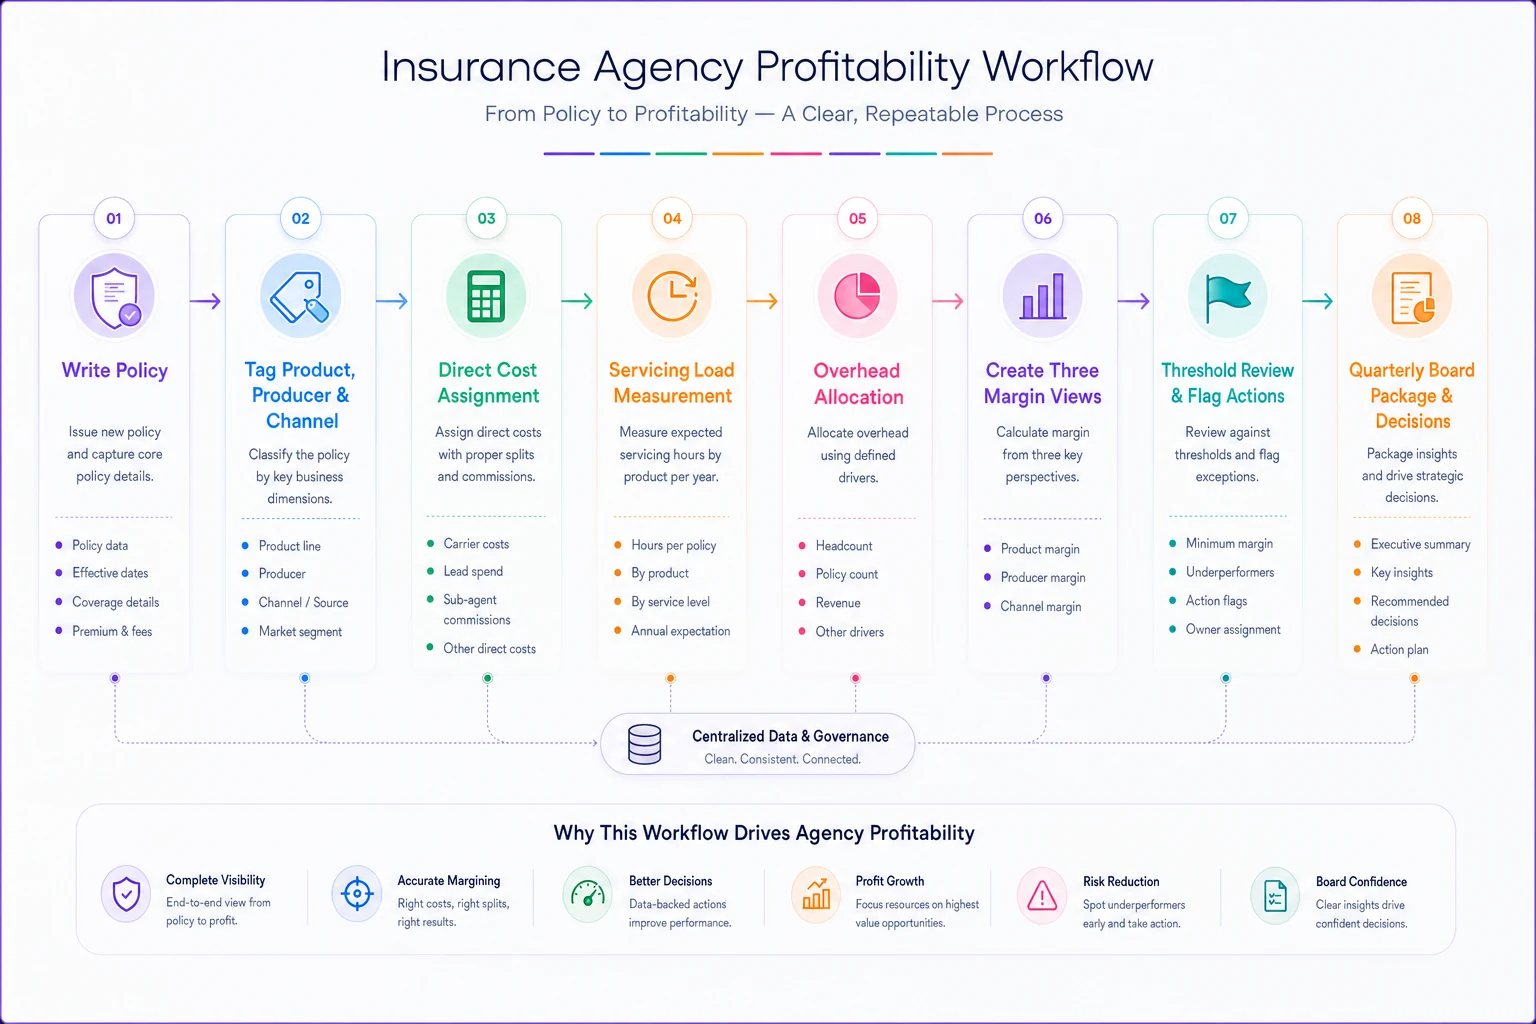
Getting the tagging right at the top of that chain is what makes everything downstream reliable. If channel origin isn't captured when the lead comes in, you're reconstructing it later from memory — which is mostly guessing.
Sample allocation rules (the part that gets argued about)
Allocation is where these projects die, because people fight over whether the rent split is "fair." Kill that debate early by picking simple, defensible drivers and writing them down. The rule doesn't have to be perfect — it has to be consistent so quarter-over-quarter comparisons mean something.
Here's a starting framework that holds up in real agencies:
| Cost category | Allocation driver | Notes |
|---|---|---|
| CSR / service payroll | Servicing hours by product | The one allocation worth measuring, not guessing |
| Producer base/draw | Direct to producer | Already belongs to a person |
| Lead spend | Direct to channel | Tag campaigns at the source |
| Management/owner comp | Blend: 50% revenue, 50% headcount | Owners split time across selling and running |
| Rent & facilities | Headcount (FTEs per product/producer team) | Simple and hard to argue with |
| AMS & core tech | Policy count | Cost scales with policies in the system |
| E&O | Revenue by product, weighted for risk | Commercial carries more exposure per dollar |
| Marketing (brand, not lead-gen) | Revenue by channel | General brand lifts all channels |
Two rules that save you pain: don't allocate below the level where you'll actually make a decision, and don't spend three days chasing the last 5% of accuracy on a cost that's 2% of the P&L. The goal is a management tool, not a forensic audit.
One pattern worth naming — agencies consistently under-allocate servicing cost to personal lines and over-allocate it to commercial. The instinct is that commercial is "more work." Per account, sure. But the sheer transaction volume on personal auto (mid-term changes, ID cards, billing calls) often means it's eating more total service hours than anyone assumed. Actually measuring the servicing load in step 3 is what corrects that bias.
Decision thresholds: turning margins into moves
A decomposed P&L is a wall of numbers until you attach thresholds — pre-agreed lines that trigger a specific action, so you're not re-litigating strategy every quarter based on mood.
-
Product line contribution margin below ~15% → review pricing mix, servicing model, or whether to keep writing it as anything but an accommodation.
-
Producer profit margin below their split threshold (they cost more than they contribute after servicing) → coaching plan, book rebalance, or a hard conversation within one quarter.
-
Channel three-year LTV-to-CAC below ~3
1
→ cut or renegotiate spend before the next budget cycle. -
Any product where servicing cost exceeds 40% of its commission → automation and tiering review before adding headcount.
-
Retention on a channel's cohort below ~80% at first renewal → the channel is buying you churn; stop feeding it.
The point of thresholds isn't to be rigid. It's to make the default an action. Without them, an underperforming channel survives for years because nobody wants to be the one who kills it. With a written 3:1 rule, the number makes the call and the meeting stays civil.
This ties directly into how you're already tracking performance. If you've built out something like the metrics in the agency owner's KPI dashboard, your thresholds should sit on top of those same numbers so the P&L review and the operational dashboard tell a consistent story instead of two contradicting ones.
A real scenario: where the money was actually going
A two-office personal-and-small-commercial shop, roughly $2.1M in revenue, three producers and four service staff. The owner was frustrated — revenue up around 9% year over year, owner comp basically flat, and he was about to hire a fifth CSR because the team felt slammed.
-
Personal auto was about 44% of policies but only around 26% of revenue — and after allocating real servicing hours, its contribution margin was hovering near 9%. It wasn't losing money, but it was funding almost none of the overhead it consumed.
-
One producer's book looked strong at roughly $480k in premium, but first-renewal retention on his purchased-lead accounts was sitting near 74%. His profit contribution after servicing and lead cost was materially lower than a second producer doing less premium entirely off referrals.
-
The "slammed" service team wasn't understaffed. Around 60% of their transactional volume was low-value personal auto churn — the exact accounts the bad channel kept feeding in.
The fix wasn't a fifth CSR. It was capping purchased-lead spend on the low-retention channel, tiering personal auto service down to a lighter-touch model, and shifting one producer's compensation toward retention. Six months later the service team absorbed volume without a new hire, and owner comp started moving because the overhead was finally being carried by profitable lines. Roughly $55k–$60k in avoided annual payroll, and a book that was quietly getting healthier at renewal.
The number that mattered most wasn't revenue. It was contribution margin by product — and it had been invisible for years inside one blended P&L.
Board-ready quarterly template
Whether your "board" is a real board, a partner, a spouse, or just future-you, the quarterly package should be short enough to read in ten minutes and specific enough to force decisions. Structure that works:
-
One-page summary total revenue, blended margin, and the single most important change since last quarter.
-
Product view contribution margin by line, with any line crossing a threshold flagged in red.
-
Producer view profit contribution per producer after servicing and comp, plus retention trend.
-
Channel view LTV-to-CAC and first-renewal retention by channel, ranked.
-
Threshold breaches a list of every line that crossed a decision threshold and the pre-agreed action.
-
Three decisions requested the specific calls you need made this quarter, each tied to a number.
That last section is the one that separates a report from a decision document. Ending with "here are three decisions and the data behind them" changes the entire tone of the meeting.
Most quarterly reviews become debates about whether something is a problem. This format skips that step.
When this level of detail makes sense — and when it doesn't
When it's worth it: You're over roughly $1M in revenue, you have multiple producers or product lines, and the blended P&L has stopped explaining your results. Also worth doing before any big move — adding a producer, entering a new product line, or evaluating an acquisition. You want to know what you're actually buying.
When it's overkill: A solo agency with one product focus and one channel doesn't need three-axis decomposition. The blended P&L plus a servicing gut-check is enough. Building an allocation model at that stage is procrastination dressed up as rigor.
Who should not do this yet: If your policy data isn't tagged cleanly — no channel origin, inconsistent product coding, producers assigned inconsistently in the AMS — fix the data hygiene first. Decomposing dirty data produces confident, wrong answers, which is worse than no answer. The channel tag in particular tends to be missing; you may need a quarter of disciplined tagging at the point of sale before the analysis means anything. That same discipline pays off in onboarding — the tagging habits in a scalable client onboarding playbook feed directly into clean P&L attribution down the line.
Making it a habit, not a heroic annual project
The first decomposition is genuinely painful — mostly the servicing measurement and the data cleanup. The second one is a fraction of the effort. By the third quarter, if your product, producer, and channel tags are captured at the moment a policy is written, the P&L slices almost fall out of the AMS.
This is where workflow automation earns its place quietly in the background — not as a dashboard you stare at, but as tagging that happens automatically at policy entry, servicing time logged against a product without anyone filling out a form, and channel origin captured when the lead comes in rather than reconstructed months later. The analysis is only as good as the tagging, and the tagging is only sustainable if it isn't manual. Agencies that get this right stop treating profitability decomposition as a special project and start treating it as something the system produces on a schedule.
The agencies that build this discipline make different decisions than the ones flying on a blended number. They cut the channel that's buying churn a year earlier. They fix the compensation structure before it costs them a good producer. They know which product lines actually pay the rent. And when they walk into a quarterly review, the conversation is about three specific decisions — not about why the bank account doesn't match the revenue chart.
Start with one axis if three feels like too much. Tag your channels, measure your servicing load, and run the product view first. Even that single slice tends to change what you do next quarter.
The agencies that build this discipline make different decisions than the ones flying on a blended number. They cut the channel that's buying churn a year earlier. They fix the compensation structure before it costs them a good producer. They know which product lines actually pay the rent. And when they walk into a quarterly review, the conversation is about three specific decisions — not about why the bank account doesn't match the revenue chart.
Start with one axis if three feels like too much. Tag your channels, measure your servicing load, and run the product view first. Even that single slice tends to change what you do next quarter.
Ready to transform your insurance agency operations?
Join 500+ agencies using Covixly to reduce manual work, improve client service, and grow their book of business.