


Most agencies work renewals in date order. Whatever's expiring in the next 45 days gets a call, an email, maybe a quote refresh. It feels organized. It's also the reason good accounts churn — because the client who was already thinking about leaving got the exact same touch as the client who was never going anywhere.
The math is brutal once you actually look at it. If your book is 2,000 policies and even 12–15% of your annual renewals sit in a "high-risk" zone, that's 240–300 relationships a year where a generic renewal notice is basically a coin flip. Handle those the same as everyone else and you're voluntarily donating retention points.
A renewal prioritization insurance scoring model fixes the sequencing problem. Instead of renewal date driving effort, risk of loss drives effort. This post walks through a scoring model you can actually reproduce — the inputs, how to weight them, sample thresholds, and the outreach cadence tied to each score band.
Why renewal date is the wrong sorting mechanism
Renewal date tells you when a policy expires. It tells you nothing about whether the client is happy, whether they've had a bad claim experience, or whether their premium just jumped 22% and they're already shopping.
The pattern that shows up constantly: an agency's CSRs are heads-down on this week's expirations. Meanwhile, an account expiring in 70 days had a claim denied last month, called in twice frustrated, and hasn't opened the last three emails. Nobody's watching that account because it's "not due yet." By the time it hits the 45-day renewal window, they've already gotten a competing quote.
Renewal date is a calendar. Retention risk is a signal. When you sort by the calendar, you find out about problems too late to do anything but react.
The other issue is effort distribution. Your team has a fixed number of hours. If those hours get spread evenly across all renewals, your stickiest clients — the ones who'd renew with zero contact — absorb time that should've gone to the accounts actually at risk. You're spending your most expensive resource (agent attention) where it changes nothing.
The four inputs that actually predict churn
You don't need twenty variables. In practice, four categories carry almost all the predictive weight, and each one is data you already have sitting in your management system.
Eliminate paperwork bottlenecks and missed deadlines.
Covixly helps you track, manage, and close every policy and claim with confidence and speed.
- Unified policy & claims management
- Automated client notifications
- Agent task coordination
No credit card required
1. Claims experience. Not just whether they had a claim — how it felt. A paid claim handled fast can increase loyalty. A denied claim, a slow claim, or a dispute is one of the strongest churn signals there is.
2. Tenure. New clients (under 18 months) leave at dramatically higher rates than clients you've held for 5+ years. Loyalty compounds. A first-term auto client is a very different retention risk than someone who's renewed with you eight times.
3. Premium change. The single most common trigger for shopping is a premium jump. A 4% increase barely registers. An 18–25% increase sends people to Google. This is often carrier-driven and completely outside your control, which is exactly why you need to see it coming.
4. Engagement. Email opens, portal logins, returned calls, document uploads. Silence is data. A client who used to respond within a day and now goes dark for weeks is telling you something.
Here's the part most agencies miss: these four don't carry equal weight, and they interact. A premium spike on a 10-year client with a great claim history is a very different situation than the same spike on an 8-month client who just had a denied claim. Your score has to capture that difference.
A reproducible scoring model you can build this week
The goal is a single number, 0–100, where higher means higher risk of loss. Score every renewal 90 days before expiration, then re-score at 60 and 30 days — signals change.
Here's a weighting structure that holds up across personal and commercial lines:
| Input | Weight | What earns points (higher = more risk) |
|---|---|---|
| Claims experience | 30 | Denied/disputed claim in last 12 mo = full points; slow-but-paid = partial; clean or positive experience = 0 |
| Premium change | 25 | 20%+ increase = full; 10–19% = partial; under 5% = 0 |
| Tenure | 25 | Under 12 mo = full; 12–36 mo = partial; 5+ years = 0 |
| Engagement | 20 | No response/opens in 60+ days = full; declining engagement = partial; active = 0 |
Visualizing the end-to-end scoring and outreach workflow can make implementation more consistent.
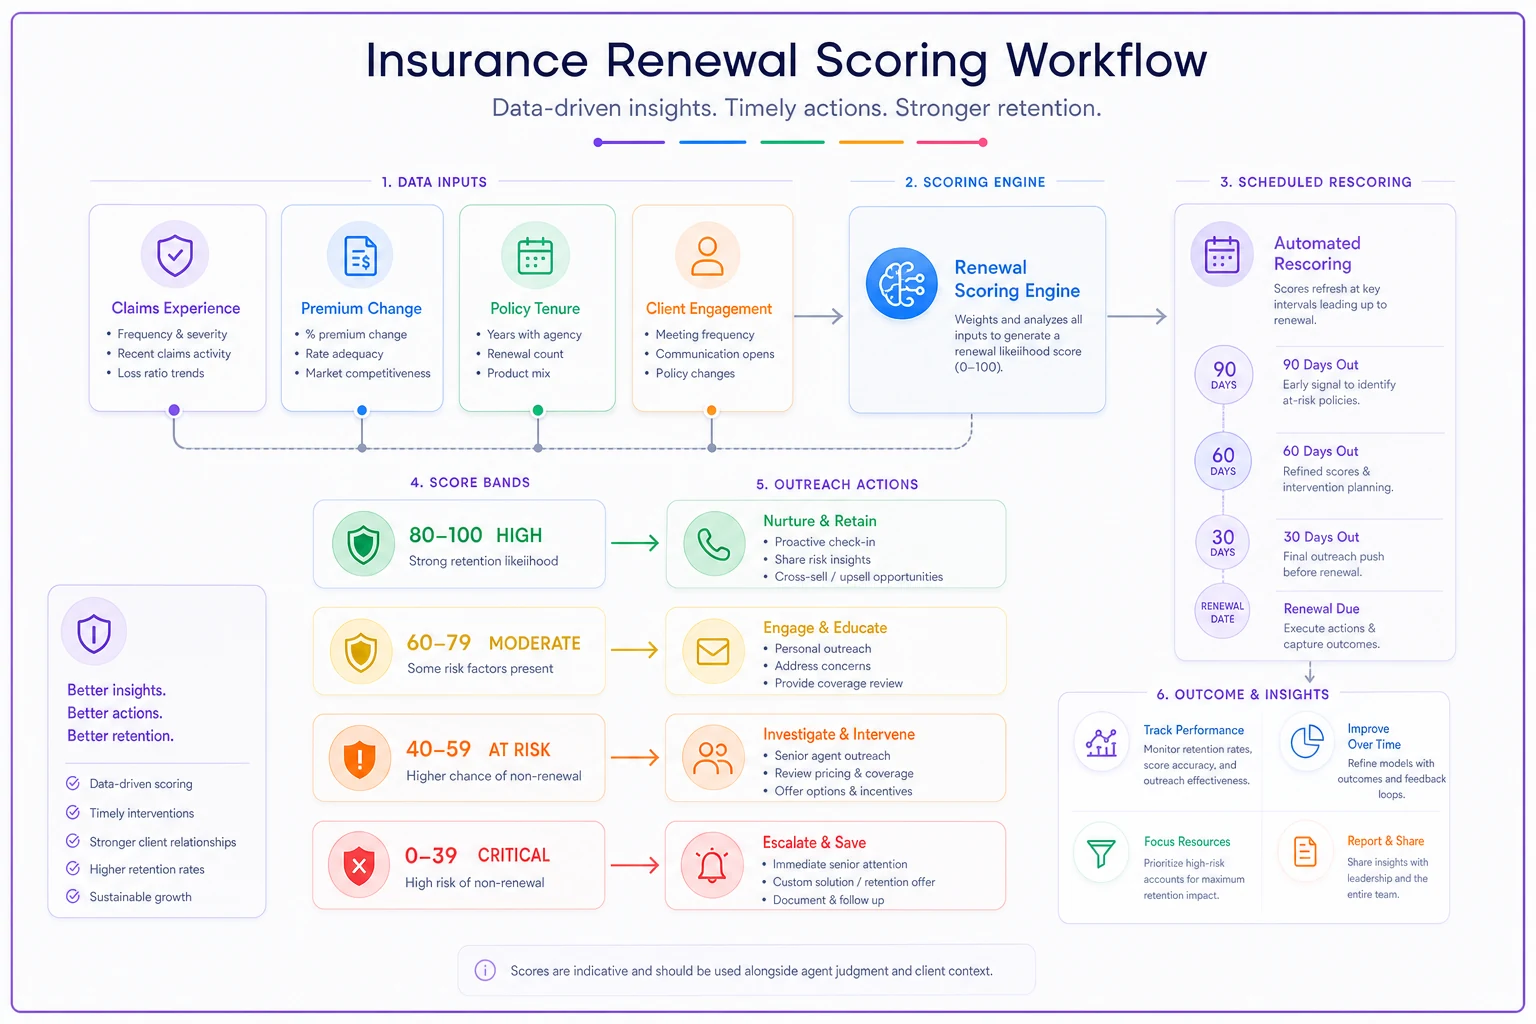
Multiply each input's raw sub-score (0–1) by its weight, add them up, and you get a 0–100 risk score.
A quick worked example. Take a commercial auto account:
-
Denied claim 4 months ago → claims sub-score 1.0 × 30 = 30
-
Premium up 16% → sub-score ~0.6 × 25 = 15
-
Tenure 14 months → sub-score ~0.7 × 25 = 17.5
-
Hasn't opened email in 70 days → sub-score 1.0 × 20 = 20
Total: 82.5 — a red-band, high-risk renewal that needs a phone call from a licensed agent, not an automated notice.
Now compare a personal home account: clean claims (0), premium up 6% (~0.2 × 25 = 5), tenure 7 years (0), actively logging into the portal (0). Score: 5. That client renews on autopilot. Every hour you don't spend on them is an hour freed up for the 82.
That contrast is the entire point of the model.
Score bands and the outreach cadence that goes with each
A score is useless without a rule that says what to do with it. Tie every band to a defined cadence so the model runs the same way whether it's a slow week or a slammed one.
Green (0–29) — Low risk. Standard automated renewal cycle. One renewal notice at 30 days, one reminder if unpaid. No agent time unless they reach out. These are roughly 55–65% of a healthy book.
Yellow (30–59) — Watch. Personalized email at 60 days referencing something specific — their coverage, a recent change, an offer to review. One CSR follow-up call if no response by 40 days. Light touch, but not automated. Usually 20–30% of the book.
Orange (60–74) — Elevated. Proactive outbound call from a CSR at 60 days before the renewal notice goes out. Goal is to surface the issue — usually premium or a claim gripe — and address it early. Coverage review offered. Roughly 8–12%.
Red (75–100) — High risk / save mode. Licensed agent, not CSR. Phone call at 75–90 days. Remarket with other carriers proactively if it's a premium problem. Manager visibility on every red account. This is your 5–8% that drives the majority of preventable churn.
The cadence discipline matters more than the exact thresholds. What kills retention isn't a slightly-off score — it's an orange account that gets a green-level touch because nobody enforced the rule.
When this model makes sense — and when it doesn't
This works well if: you have at least ~800–1,000 policies, reasonably clean data in your management system, and a team that can actually execute differentiated outreach. Below that volume, you probably already know your at-risk accounts by name and a formal model is overkill.
This is a bad idea if: your data hygiene is a mess. If premium change fields are blank half the time and claims notes live in three different systems, your scores will be garbage and your team will stop trusting them within a month. Fix the data first. A model built on bad inputs is worse than no model — it creates false confidence.
Who should skip it entirely: brand-new agencies under a few hundred policies. Your time is better spent on onboarding and growth. Build the scoring habit once your book is big enough that you can't hold every renewal in your head.
Where the model quietly breaks in real operations
A few failure patterns worth naming before you build this.
Scoring once and forgetting. A client scored green at 90 days can have a denied claim at day 50 and flip to red. If you only score once, you miss the exact accounts the model exists to catch. Re-score at 60 and 30.
Weighting tenure too low. Agencies love chasing premium spikes and under-weight tenure. But a premium jump on a 6-year loyal client rarely triggers a switch — the relationship carries it. A premium jump on a first-term client almost always triggers shopping. Tenure isn't a tiebreaker; it's a multiplier on everything else.
No feedback loop. Track which scored accounts actually churned. If reds are renewing at 90% and greens are churning at 20%, your weights are wrong. Review the model quarterly against actual lost-business reports and adjust.
Re-score at 60 and 30 days to catch accounts that flip bands between runs.
Pulling claims, premium history, tenure, and engagement into one place is the operationally hard part — that data is usually scattered across systems. This is where a management platform with built-in automation earns its keep: it can pull those inputs, calculate the score on a schedule, flag band changes, and drop the right accounts into the right team member's queue with the correct cadence attached. The scoring logic itself is simple. Making it run automatically across 2,000 renewals every month, without someone manually rebuilding a spreadsheet, is the part that actually saves the book.
A real scenario
A mid-size personal lines agency, roughly 2,300 policies, was running renewals strictly by date. Retention sat around 84% — not terrible, but they were losing close to 370 policies a year and couldn't identify which losses were preventable.
They built a version of the model above, scored the next two quarters of renewals, and pulled out the orange and red bands — about 240 accounts. Instead of a generic notice, reds got an agent call 75+ days out, and premium-driven reds got proactively remarketed before they ever thought to shop.
Over the following two renewal cycles, retention on that high-risk group moved from roughly 61% to the mid-70s. Overall book retention ticked up a couple of points — sounds small, but on a 2,300-policy book that's somewhere around 45–50 policies saved a year that would've otherwise walked. The bigger operational win: the team stopped spending equal energy on clients who were never leaving.
The takeaway
The problem was never that agencies don't work their renewals. It's that they work them in the wrong order, with equal effort, based on a calendar instead of risk. A reproducible scoring model — four inputs, clear weights, defined bands, and a cadence attached to each — puts your best people in front of the accounts actually at risk of leaving, and lets everyone else renew quietly in the background.
Start with the four inputs you already have. Score one quarter of upcoming renewals. See where your reds are. You'll almost certainly find a handful of good accounts you would've lost by treating them like everyone else.
Ready to transform your insurance agency operations?
Join 500+ agencies using Covixly to reduce manual work, improve client service, and grow their book of business.